Dimensionality Reduction
In this section you can find how to use the dimensionality reduction window.
Create embedding
Upon loading the window, the user is shown some options. When no embedding has been created yet, the user has to create one. For this, first select an overlay from the dropdown menu. Next, select an element and threshold. The element and threshold are used to filter the data used for the dimensionality reduction. Then select the Generate button. After some time (up to a couple of minutes), the user will be shown the embedding with the selected overlay.
Show overlay
When having generated an embedding, the user can show a different overlay on top. For this simply select the overlay from the dropdown menu and click the show overlay button. Loading the overlay can take a couple of seconds, depending on the size of the embedding.
Use the selection tool
When showing an embedding image, the user can use the polygon tool to see the relation between the painting and the embedding. For this, select the polygon tool or the rectangle tool from the toolbar in the dimensionality reduction window. By clicking (in the case of the polygon tool), or clicking and dragging (in the case of the rectangle tool), the user can select a region in the embedding. The indices corresponding to the selected region are then shown in the painting.
How the generation of the embedding works
The element and threshold are used to filter the data used for the dimensionality reduction. It does this by looking at the normalized elemental map corresponding to the given element. Then, it selects all indices in the normalized elemental map for which the intensity is above the threshold. Finally, the pixels in the elemental data cube at these indices are used for the dimensionality reduction.
However, for some threshold values the number of indices that satisfy the condition is larger than the maximum allowed number of indices. To combat this, the server will down sample the data at random to the maximum allowance. This maximum is set to make sure that the generation time of the embedding is not too long. When the indices are down sampled, a pop-up message will appear indication that this has happened.
For the polygon tool, the non-down sampled indices are used. The values in the embedding corresponding to the indices that were not in the down sampled set are determined by nearest neighbor interpolation. This is done to make the highlighting of the polygon tool more visible.
Interpretation of the embedding
When setting the threshold to zero, selecting an element (does not matter which one), and generating the embedding, one will get a similar image as shown below. This image may differ, since a random initialization is used in the dimensionality reduction method. As overlay the RGB image is used.
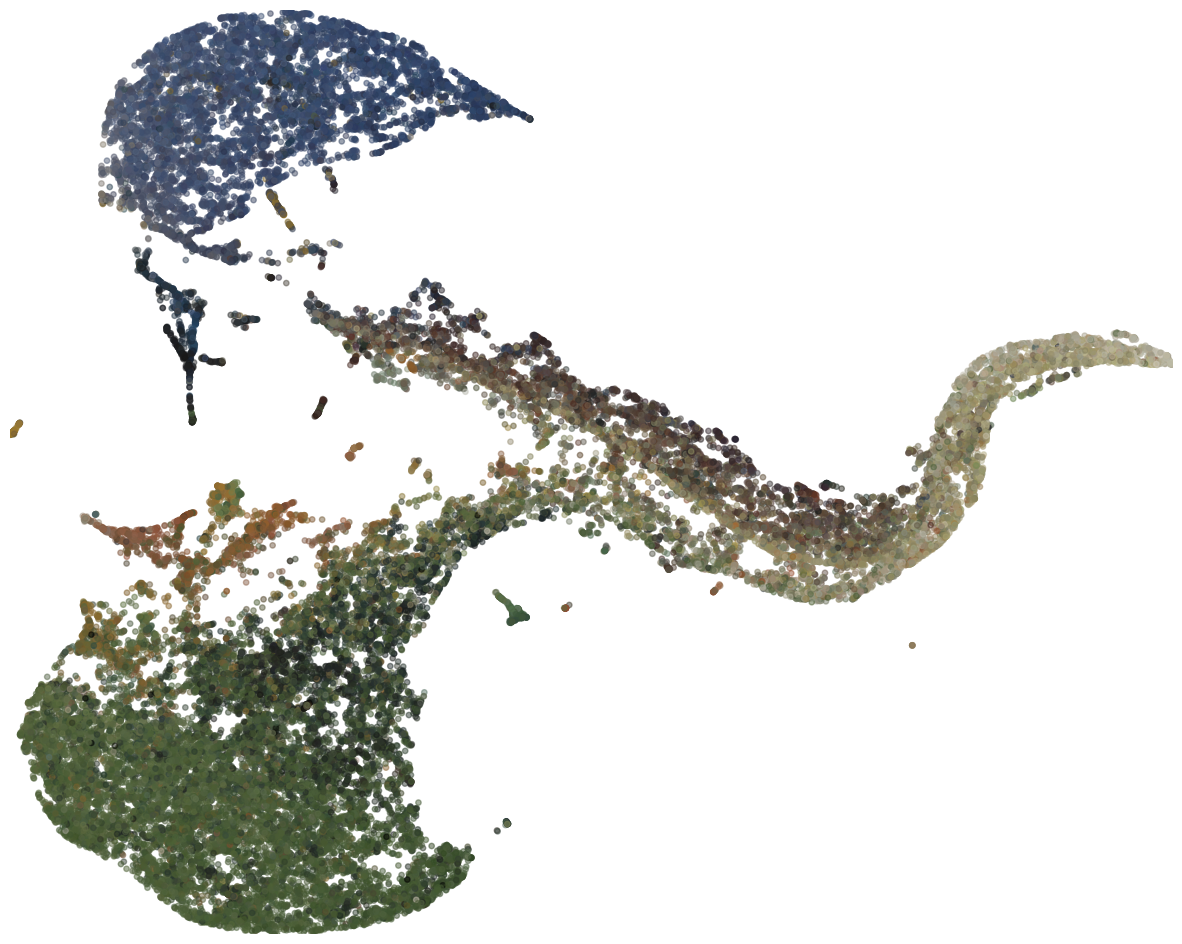
As can be seen, the colors of the points in the embedding are grouped together. Moreover, when using the selection tool, it can be seen that groups of points correspond to certain aspects in the painting. For example, when selecting the blue region, all blue pixels in the painting will be highlighted.